Collecting Kubernetes Metrics Data with OpenTelemetry Collector
Kubernetes has become a widely adopted industry tool, and the need for observability tools continues to grow. In response, OpenTelemetry has created a number of different tools to help Kubernetes users observe their clusters and services.
Next we will start monitoring the Kubernetes cluster using OpenTelemetry and will focus on collecting metrics and logs from the Kubernetes cluster, nodes, pods, and containers and enabling the cluster to support services that emit OTLP data.
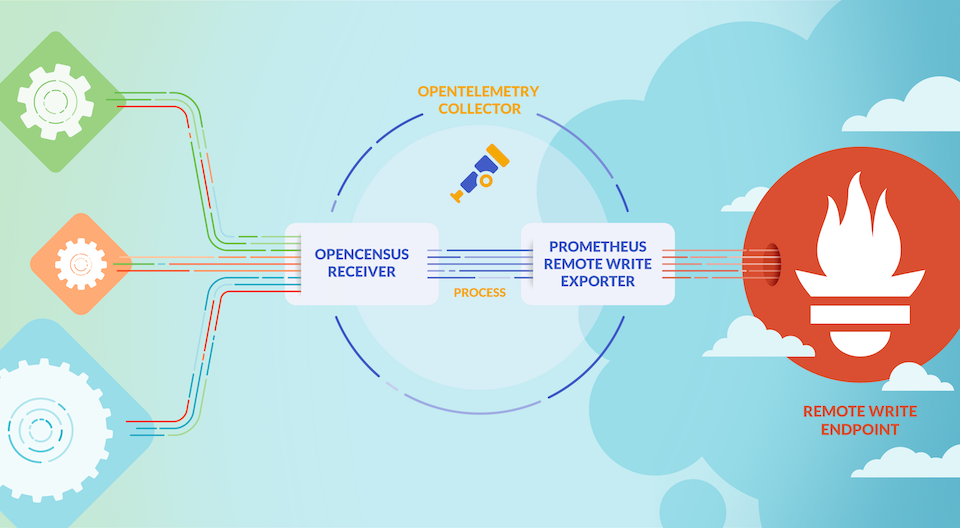
Kubernetes exposes a lot of important telemetry data in many different ways. It has logs, events, and metrics for many different objects, as well as data generated by its workloads. To collect this data, we’ll use the OpenTelemetry Collector, which collects all of this data efficiently.
In order to collect all the data, we will need to install two collectors, one as Daemonset and one as Deployment.The DaemonSet of the collectors will be used to collect metrics for the services, logs and nodes, Pods and containers, while the Deployment will be used to collect metrics and events for the cluster.
To install the collector, we’ll use the OpenTelemetry Collector Helm chart(https://github.com/open-telemetry/opentelemetry-helm-charts/tree/main/charts/opentelemetry-collector) here, which comes with some configuration options to make it easier to configure the collector.
First you need to add the OpenTelemetry Helm repository:
$ helm repo add open-telemetry https://open-telemetry.github.io/opentelemetry-helm-charts
$ helm repo update
The first step in collecting Kubernetes telemetry data is to deploy a DaemonSet instance of OpenTelemetry Collector to collect telemetry data related to the nodes and the workloads running on those nodes. Using a DaemonSet ensures that this collector instance is installed on all nodes. Each Collector instance in a DaemonSet will collect data only from the nodes on which it is running.
Configuring all of these components is very simple with OpenTelemetry Collector Helm Chat, which also handles all of the Kubernetes-related details, such as RBAC, mounts, and host ports. Note, however, that by default this Chart does not send data to any backend.
Metrics Collection
We start here by creating a Prometheus instance to collect metrics data. As shown below, we use Helm Chart to quickly deploy Prometheus.
$ helm repo add prometheus-community https://prometheus-community.github.io/helm-charts
$ helm repo update
Then create a prometheus-values.yaml file to configure the Prometheus Helm Chart.
# prometheus-values.yaml
kubeStateMetrics:
  enabled: false

nodeExporter:
  enabled: false

kubelet:
  enabled: false

kubeApiServer:
  enabled: false

kubeControllerManager:
  enabled: false

coreDns:
  enabled: false

kubeDns:
  enabled: false

kubeEtcd:
  enabled: false

kubeScheduler:
  enabled: false

kubeProxy:
  enabled: false

sidecar:
  datasources:
    label: grafana_datasource
    labelValue: "1"
  dashboards:
    enabled: true

prometheus:
  prometheusSpec:
    enableFeatures:
      - remote-write-receiver

prometheusOperator:
  enabled: true
  admissionWebhooks:
    patch:
      enabled: true
      image:
        registry: cnych
        repository: ingress-nginx-kube-webhook-certgen
        tag: v20221220-controller-v1.5.1-58-g787ea74b6

grafana:
  ingress:
    enabled: true
    ingressClassName: nginx
    hosts:
      - grafana.k8s.local
Note that we are not customising any Exporter here as we will be using OpenTelemetry Collector to collect the metrics data before sending it to Prometheus. Additionally, in order to be able to send the collector metrics to Prometheus, we need to enable remote writing, which would normally be done by specifying --web.enable-remote-write-receiver in the Prometheus startup parameter, but we’re deploying it through the Prometheus Operator. However, we are deploying via Prometheus Operator, so we need to modify the CR instance object of Prometheus to enable the remote-write-receiver feature. We have also enabled Ingress for Grafana so that we can access Grafana via grafana.k8s.local with a default username of admin and password of prom-operator.
Next, you can deploy Prometheus directly with one click using the following command.
$ helm upgrade --install prometheus prometheus-community/kube-prometheus-stack -f prometheus-values.yaml --namespace kube-otel --create-namespace
Release "prometheus" does not exist. Installing it now.

NAME: prometheus
LAST DEPLOYED: Wed Aug 23 09:42:23 2023
NAMESPACE: kube-otel
STATUS: deployed
REVISION: 1
NOTES:
kube-prometheus-stack has been installed. Check its status by running:
  kubectl --namespace kube-otel get pods -l "release=prometheus"

Visit https://github.com/prometheus-operator/kube-prometheus for instructions on how to create & configure Alertmanager and Prometheus instances using the Operator.
The deployed resource object is shown below.
$ kubectl get pods -n kube-otel
NAME                                                     READY   STATUS    RESTARTS   AGE
alertmanager-prometheus-kube-prometheus-alertmanager-0   2/2     Running   0          6m3s
prometheus-grafana-5d95cbc57f-v2bw8                      3/3     Running   0          61s
prometheus-kube-prometheus-operator-74fcfc7ff6-2bzfj     1/1     Running   0          6m19s
prometheus-prometheus-kube-prometheus-prometheus-0       2/2     Running   0          6m3s
$ kubectl get ingress -n kube-otel
NAME                 CLASS   HOSTS               ADDRESS       PORTS   AGE
prometheus-grafana   nginx   grafana.k8s.local   10.98.12.94   80      114s
Now we need to send the metrics data to Prometheus, so we need to configure the exporter inside the Otel collector, either using the prometheus or prometheusremotewrite exporter. We will use the following otel-collector-ds-values.yaml file to configure the OpenTelemetry Collector Helm Chart.
# otel-collector-ds-values.yaml
mode: daemonset

tolerations:
  - key: node-role.kubernetes.io/control-plane
    effect: NoSchedule

clusterRole:
  create: true
  rules:
    - apiGroups:
        - ""
      resources:
        - nodes/proxy
      verbs:
        - get
        - watch
    - apiGroups:
        - ""
      resources:
        - nodes
      verbs:
        - list
        - watch
        - get

presets:
  hostMetrics:
    enabled: true
  kubernetesAttributes:
    enabled: true
  kubeletMetrics:
    enabled: true

ports:
  prom: # Add a 9090 port for Prometheus
    enabled: true
    containerPort: 9090
    servicePort: 9090
    protocol: TCP

service: # Create a Service, which will be used by ServiceMonitor later.
  enabled: true

config:
  receivers:
    prometheus:
      config:
        scrape_configs:
          - job_name: opentelemetry-collector
            scrape_interval: 10s
            static_configs:
              - targets:
                  - ${env:MY_POD_IP}:8888
  exporters:
    logging:
      loglevel: debug
    prometheus:
      endpoint: "0.0.0.0:9090"
      metric_expiration: 180m
      resource_to_telemetry_conversion:
        enabled: true
    # prometheusremotewrite:
    #   endpoint: http://prometheus-kube-prometheus-prometheus:9090/api/v1/write
    #   tls:
    #     insecure: true
  processors:
    metricstransform:
      transforms:
        include: .+
        match_type: regexp
        action: update
        operations:
          - action: add_label
            new_label: k8s.cluster.id
            new_value: abcd1234
          - action: add_label
            new_label: k8s.cluster.name
            new_value: youdian-k8s
  service:
    pipelines:
      metrics:
        exporters:
          - prometheus
        processors:
          - memory_limiter # Memory limits are generally placed at the top
          - metricstransform
          - k8sattributes
          - batch # Batch processor at the end
        receivers:
          - otlp
          - hostmetrics
          - kubeletstats
          - prometheus
Deploy the OpenTelemetry Collector DaemonSet directly using the configuration file above:
$ helm upgrade --install opentelemetry-collector open-telemetry/opentelemetry-collector -f otel-ds-values.yaml --namespace kube-otel --create-namespace
$ kubectl get pods -n kube-otel
NAME                                                     READY   STATUS      RESTARTS   AGE
opentelemetry-collector-agent-22rsm                      1/1     Running     0          18h
opentelemetry-collector-agent-v4nkh                      1/1     Running     0          18h
opentelemetry-collector-agent-xndlq                      1/1     Running     0          18h
After installation we can view the current collector configuration information using the command kubectl get cm -n kube-otel opentelemetry-collector-agent -oyaml.
exporters:
  logging:
    loglevel: debug
  prometheus:
    endpoint: 0.0.0.0:9090
    metric_expiration: 180m
    resource_to_telemetry_conversion:
      enabled: true
extensions:
  health_check: {}
  memory_ballast:
    size_in_percentage: 40
processors:
  batch: {}
  k8sattributes:
    extract:
      metadata:
        - k8s.namespace.name
        - k8s.deployment.name
        - k8s.statefulset.name
        - k8s.daemonset.name
        - k8s.cronjob.name
        - k8s.job.name
        - k8s.node.name
        - k8s.pod.name
        - k8s.pod.uid
        - k8s.pod.start_time
    filter:
      node_from_env_var: K8S_NODE_NAME
    passthrough: false
    pod_association:
      - sources:
          - from: resource_attribute
            name: k8s.pod.ip
      - sources:
          - from: resource_attribute
            name: k8s.pod.uid
      - sources:
          - from: connection
  memory_limiter:
    check_interval: 5s
    limit_percentage: 80
    spike_limit_percentage: 25
  metricstransform:
    transforms:
      action: update
      include: .+
      match_type: regexp
      operations:
        - action: add_label
          new_label: k8s.cluster.id
          new_value: abcd1234
        - action: add_label
          new_label: k8s.cluster.name
          new_value: youdian-k8s
receivers:
  hostmetrics:
    collection_interval: 10s
    root_path: /hostfs
    scrapers:
      cpu: null
      disk: null
      filesystem:
        exclude_fs_types:
          fs_types:
            - autofs
            - binfmt_misc
            - bpf
            - cgroup2
            - configfs
            - debugfs
            - devpts
            - devtmpfs
            - fusectl
            - hugetlbfs
            - iso9660
            - mqueue
            - nsfs
            - overlay
            - proc
            - procfs
            - pstore
            - rpc_pipefs
            - securityfs
            - selinuxfs
            - squashfs
            - sysfs
            - tracefs
          match_type: strict
        exclude_mount_points:
          match_type: regexp
          mount_points:
            - /dev/*
            - /proc/*
            - /sys/*
            - /run/k3s/containerd/*
            - /var/lib/docker/*
            - /var/lib/kubelet/*
            - /snap/*
      load: null
      memory: null
      network: null
  kubeletstats:
    auth_type: serviceAccount
    collection_interval: 20s
    endpoint: ${K8S_NODE_NAME}:10250
  otlp:
    protocols:
      grpc:
        endpoint: ${env:MY_POD_IP}:4317
      http:
        endpoint: ${env:MY_POD_IP}:4318
  prometheus:
    config:
      scrape_configs:
        - job_name: opentelemetry-collector
          scrape_interval: 10s
          static_configs:
            - targets:
                - ${env:MY_POD_IP}:8888
service:
  extensions:
    - health_check
    - memory_ballast
  pipelines:
    metrics:
      exporters:
        - prometheus
      processors:
        - memory_limiter
        - metricstransform
        - k8sattributes
        - batch
      receivers:
        - otlp
        - hostmetrics
        - kubeletstats
        - prometheus
  telemetry:
    metrics:
      address: ${env:MY_POD_IP}:8888
# ...... Omit the rest.
The above configuration information is the real runtime configuration of OpenTelemetry Collector, we only keep the metrics related configuration here. As you can see from the above configuration file we have defined 4 receivers:
- hostmetrics receiver
- kubeletstats receiver
- otlp receiver
- prometheus receiver
4 processors:
- batch processor
- memory_limiter processor
- k8sattributes processor
- metricstransform processor
2 exporters:
- logging exporter
- prometheus exporter
Let’s introduce the other components in more detail.
otlp receiver
The otlp receiver is the best solution for collecting traces, metrics, and logs in OTLP format. If you are sending out application telemetry data in another format, then the collector will most likely have a corresponding receiver as well. This is something we’ve covered in detail earlier, and we’ve defined the http and grpc protocols here, listening on ports 4317 and 4318 respectively. The configuration is shown below.
receivers:
  otlp:
    protocols:
      grpc:
        endpoint: ${env:MY_POD_IP}:4317
      http:
        endpoint: ${env:MY_POD_IP}:4318
hostmetrics receiver
The hostmetrics receiver is used to collect host-level metrics such as CPU usage, disk usage, memory usage, and network traffic. Our configuration here is shown below.
receivers:
  hostmetrics:
    collection_interval: 10s
    root_path: /hostfs
    scrapers:
      cpu: null
      disk: null
      filesystem:
        exclude_fs_types:
          fs_types:
            - autofs
            - binfmt_misc
            - bpf
            - cgroup2
            - configfs
            - debugfs
            - devpts
            - devtmpfs
            - fusectl
            - hugetlbfs
            - iso9660
            - mqueue
            - nsfs
            - overlay
            - proc
            - procfs
            - pstore
            - rpc_pipefs
            - securityfs
            - selinuxfs
            - squashfs
            - sysfs
            - tracefs
          match_type: strict
        exclude_mount_points:
          match_type: regexp
          mount_points:
            - /dev/*
            - /proc/*
            - /sys/*
            - /run/k3s/containerd/*
            - /var/lib/docker/*
            - /var/lib/kubelet/*
            - /snap/*
      load: null
      memory: null
      network: null
Collecting metrics every 10 seconds is specified through collection_interval and uses the root path /hostfs to access the host filesystem.
The hostmetrics receiver includes several scrapers for collecting different types of metrics. For example, cpu scraper is used to collect CPU usage metrics, disk scraper is used to collect disk usage metrics, memory scraper is used to collect memory usage metrics, and load scraper is used to collect CPU load metrics. In this configuration file, we only enable filesystem scraper to collect filesystem usage metrics.
The configuration of filesystem scraper specifies to exclude certain filesystem types and mount points from metrics collection. Specifically, it excludes the filesystem types autofs, binfmt_misc, bpf, cgroup2 … It also excludes the mount points /dev/*, /proc/*, /sys/*, /run/k3s/containerd/*, /var/lib/docker/*, /var/lib/kubelet/*, and /snap/*, and these exclusions ensure that only relevant file system usage metrics.
kubeletstats receiver
The Kubelet Stats Receiver is used to fetch metrics from the API server on kubelet. It is typically used to collect metrics related to Kubernetes workloads, such as CPU usage, memory usage, and network traffic. These metrics can be used to monitor the health and performance of Kubernetes clusters and workloads.
The Kubelet Stats Receiver supports secure Kubelet endpoints exposed on port 10250 and read-only Kubelet endpoints exposed on port 10255 by default. If auth_type is set to none, read-only endpoints are used. If auth_type is set to any of the following values, a secure endpoint is used.
tlstells this recipient to use TLS for authentication and requires theca_file,key_file, andcert_filefields to be set.serviceAccountTells this recipient to use the default ServiceAccount token to authenticate to the kubelet API.kubeConfigTells this receiver to use thekubeconfigfile (KUBECONFIGenvironment variable or~/.kube/config) to authenticate and use the APIServer proxy to access the kubelet API.initial_delay(default = 1 second) defines how long the receiver waits before starting.
The following parameters can also be specified:
collection_interval(default= 10s), the time interval for collecting data.insecure_skip_verify(default= false), whether to skip certificate verification.
By default, all generated metrics are based on the resource labels provided by the kubelet’s /stats/summary endpoint. For some scenarios, this may not be sufficient. Therefore, other endpoints can be utilised to obtain additional metadata and set them as additional labels for the metrics resources. Currently supported metadata includes the following.
container.id- Enhances the metrics with a container ID tag obtained from the container state exposed via/pods.k8s.volume.type- Collect the volume type from the Pod specification exposed via/podsand use it as a label for the volume metrics. If the endpoint provides information beyond just the volume type, this information is also synchronised based on the available fields and the volume type. For example,aws.volume.idwill be synced fromawsElasticBlockStoreandgcp.pd.namewill be synced fromgcePersistentDisk.
If you wish to add the container.id label to your metrics, enable it using the extra_metadata_labels field, for example:
receivers:
  kubeletstats:
    collection_interval: 10s
    auth_type: "serviceAccount"
    endpoint: "${env:K8S_NODE_NAME}:10250"
    insecure_skip_verify: true
    extra_metadata_labels:
      - container.id
If extra_metadata_labels is not set, no additional API calls are made to get additional metadata.
By default, this collector will collect metrics from containers, pods and nodes. We can specify the sources of data to be collected by setting a metric_groups, which can specify values such as container, pod, node and volume. For example, if you want to collect node and pod metrics only from the receiver, you can use the following configuration.
receivers:
  kubeletstats:
    collection_interval: 10s
    auth_type: "serviceAccount"
    endpoint: "${env:K8S_NODE_NAME}:10250"
    insecure_skip_verify: true
    metric_groups:
      - node
      - pod
The K8S_NODE_NAME environment variable can be injected inside a Kubernetes cluster via the Downward API.
prometheus receiver
The Prometheus receiver receives metric data in Prometheus format. The receiver is intended to be a replacement for Prometheus to the greatest extent possible, but the following advanced features of Prometheus are not currently supported:
alert_config.alertmanagersalert_config.relabel_configsremote_readremote_writerule_files
This receiver is a direct replacement for letting Prometheus scrape your services. It supports the full Prometheus configuration in scrape_config, including service discovery. Just as if you wrote it in a YAML configuration file before starting Prometheus. Example:
prometheus --config.file=prom.yaml
Note: Since the collector configuration supports env variable substitution, the
$character in the prometheus configuration will be interpreted as an environment variable. If you want to use the$character in the prometheus configuration, you must escape it with$$.
For example, we can have the collector receive metrics data from Prometheus with the following configuration, which is used in the same way as Prometheus, just by adding a task to scrape_configs.
receivers:
  prometheus:
    config:
      scrape_configs:
        - job_name: opentelemetry-collector
          scrape_interval: 10s
          static_configs:
            - targets:
                - ${env:MY_POD_IP}:8888
        - job_name: k8s
          kubernetes_sd_configs:
            - role: pod
          relabel_configs:
            - source_labels:
                [__meta_kubernetes_pod_annotation_prometheus_io_scrape]
              regex: "true"
              action: keep
          metric_relabel_configs:
            - source_labels: [__name__]
              regex: "(request_duration_seconds.*|response_duration_seconds.*)"
              action: keep
The opentelemetry-collector task that we’ve added here is going to grab the data on port 8888, which is the port of the OpenTelemetry Collector, which we’ve defined in service.telemetry, so that we can grab the metrics data for the OpenTelemetry Collector itself through that receiver.
batch processor
Batch processors take traces, metrics, or logs and process them in batches. Batch processing helps to compress data better and reduces the number of external connections required to transfer data. The processor supports batch processing based on size and time.
It is highly recommended to configure the batch processor on each collector. The batch processor should be defined in the pipeline after the memory limiter (memory_limiter) and any other sampling processors. This is because batch processing should occur after any data sampling.
A number of parameters can be configured in the batch processor as shown below:
send_batch_size(default = 8192): the batch will be sent as soon as this number of traces, metrics data, or log entries is reached, regardless of the timeout.send_batch_sizeacts as a trigger and does not affect the batch size. If you need to force a limit on the size of the batch sent to the next component in the pipeline, you can configuresend_batch_max_size.timeout(default = 200ms): the batch will be sent immediately after a certain amount of time has elapsed, regardless of the batch size. If set to zero,send_batch_sizeis ignored because the data will be sent immediately, limited only bysend_batch_max_size.send_batch_max_size(default = 0): upper limit on batch size. 0 means there is no upper limit on batch size, this attribute ensures that larger batches are split into smaller units. It must be greater than or equal tosend_batch_size.metadata_keys(default = empty): when set, this handler will create a batch program instance for each different combination of values inclient.Metadata.metadata_cardinality_limit(default=1000): whenmetadata_keysis not empty, this setting limits the number of unique combinations of metadata key values that will be processed over the lifetime of the process.
For example, the following configuration contains a default batch processor and a second batch processor with customized settings. The batch processor batch/2 will buffer up to 10,000 spans, metrics data points, or log records in 10 seconds without splitting data items to enforce the maximum batch size.
processors:
  batch:
  batch/2:
    send_batch_size: 10000
    timeout: 10s
The following configuration will enforce the maximum batch size limit of 10,000 spans, metrics data points, or log records without introducing any artificial delays.
processors:
  batch:
    send_batch_max_size: 10000
    timeout: 0s
memory_limiter handler
The memory limiter handler is used to prevent out-of-memory situations for the collector. Considering that the amount and type of data processed by the collector is environment-specific and that the resource utilization of the collector depends on the configured processor, it is important to keep a check on memory usage.
The memory_limiter handler allows memory usage to be checked periodically, and if the defined limit is exceeded, it will start rejecting data and force GC to reduce memory consumption. memory_limiter Uses both soft and hard memory limits, with the hard limit always being higher or equal to the soft limit.
Memory usage varies over time. The hard limit is the maximum amount of memory allocated to the process heap, above which a memory limit operation is triggered. The soft limit is the threshold below which memory usage drops below the hard limit and normal operation resumes.
For example, if you define the hard limit limit_mib to be 100 MiB and the soft limit to be 80 MiB, then spike_limit_mib will be 20 MiB When memory usage exceeds the hard limit, the processor will reject data and force garbage collection to try to free up memory. When memory usage exceeds the soft limit, the processor will enter memory limit mode, and if memory usage drops below the soft limit, normal operation will resume, data will no longer be rejected, and no forced garbage collection will be performed.
In memory-limited mode, the error returned by the processor is a non-permanent error. When the receiver side sees this error, they will retry sending the same data.
It is highly recommended to configure the ballast extension as well as the memory_limiter processor on each collector. ballast extension should be configured as 1/3 to 1/2 of the memory allocated to the collector. the memory_limiter processor should be the first processor defined in the pipeline (immediately after the receiver). This is to ensure that backpressure can be sent to the applicable receiver and to minimize the possibility of data loss when the memory_limiter is triggered.
The main configuration options for the Memory Limiter include the following:
check_interval(default = 0s): used to specify the time interval for checking memory usage. For example, setting it to 5s means to check memory usage every 5 seconds.limit_mib(default = 0): the maximum amount of memory (in MiB) allocated by the process heap. Note that normally the total memory usage of the process will be about 50MiB higher than this value, which defines a hard limit.spike_limit_mib(default = 20% oflimit_mib): the maximum peak expected between memory usage measurements. This value must be less thanlimit_mib. The soft limit value will be equal tolimit_mib - spike_limit_mib. The recommended value forspike_limit_mibis approximately 20% oflimit_mib.limit_percentage(default = 0): the maximum amount of total memory to be allocated by the process heap. This configuration is supported on Linux systems with cgroups and is intended for dynamic platforms like docker. This option is used to calculate the memory limit based on the total memory available. For example, a setting of 75% and 1GiB of total memory will limit it to 750 MiB. fixed memory settings (limit_mib) take precedence over percentage configurations.spike_limit_percentage(default = 0): the maximum peak expected between memory usage measurements. The value must be less thanlimit_percentage. This option is used to calculatespike_limit_mibbased on the total available memory. For example, if the total memory is 1GiB, a setting of 25% limits the peak to 250MiB. this option is only used withlimit_percentage.
k8sattributes processor
The Kubernetes attributes processor allows tracing, metrics, and logging resource attributes to be set automatically using K8s metadata. When the k8sattributes processor is applied to a Pod in a Kubernetes cluster, it extracts a number of attributes from the Pod’s metadata, such as the Pod’s name, UID, start time, and other metadata. These attributes will be sent to the backend along with the telemetry data so that when analyzing and debugging the telemetry data you can better understand which Pod they came from.
In the k8sattributes handler, the pod_association attribute defines how telemetry data is associated with a Pod. For example, if a Pod sends more than one piece of telemetry data, those telemetry data will be associated to the same Pod so that subsequent analysis and debugging can better understand which Pod they came from.
For example, the processor we define here is shown below:
k8sattributes:
  extract:
    metadata: # List the metadata attributes to be extracted from k8s
      - k8s.namespace.name
      - k8s.deployment.name
      - k8s.statefulset.name
      - k8s.daemonset.name
      - k8s.cronjob.name
      - k8s.job.name
      - k8s.node.name
      - k8s.pod.name
      - k8s.pod.uid
      - k8s.pod.start_time
  filter: # Only data from nodes matching this value will be considered.
    node_from_env_var: K8S_NODE_NAME
  passthrough: false # Indicates that the processor will not pass any data that does not meet the filter criteria.
  pod_association:
    - sources:
        - from: resource_attribute # from Indicates the type of rule
          name: k8s.pod.ip
    - sources:
        - from: resource_attribute # resource_attribute Indicates the name of the attribute to look up from the list of attributes of the received resource.
          name: k8s.pod.uid
    - sources:
        - from: connection
Where the extract option lists the metadata attributes to be extracted from Kubernetes, which in our case includes Namespace, Deployment, StatefulSet, DaemonSet, CronJob, Job, Node, Pod Name, Pod UID, and Pod Startup Time. The filter attribute specifies that only data from nodes whose names match the value of the K8S_NODE_NAME environment variable will be considered. The passthrough option is set to false, which means that the processor will not pass any data that does not match the filter criteria.
Finally, the pod_association option defines how pod metadata extracted from Kubernetes is associated with telemetry data. In this configuration file, the pod_association attribute defines three association sources, k8s.pod.ip, k8s.pod.uid, and connection.
- The first association source is
k8s.pod.ip, which uses the Pod IP as the source of the association. This means that all telemetry sent from the same Pod IP will be associated with the same Pod. - The second association source is
k8s.pod.uid, which uses the Pod UID as the source of the association. This means that all telemetry sent from the same Pod UID will be associated with the same Pod. - The third association source is
connection, which uses connection information as the source of the association. This means that all telemetry sent from the same connection will be associated with the same Pod.
If no Pod association rules are configured, resources are associated with metadata only through connected IP addresses.
Through these association sources, the pod_association property ensures that telemetry data is associated with the correct Pod, making it easier and more accurate when analyzing and debugging telemetry data.
The metadata to be collected is determined by a defined metadata configuration that defines the list of resource attributes to be added. The items in the list are identical to the names of the resource attributes that will be added. The following attributes are added by default:
k8s.namespace.namek8s.pod.namek8s.pod.uidk8s.pod.start_timek8s.deployment.namek8s.node.name
You can change this list using the metadata configuration. Not all attributes can be added. Only attribute names from metadata should be used for resource_attribute for pod_association, null or non-existent values will be ignored.
Additionally k8sattributesprocessor can set resource attributes via pod and namespace tags and annotations.
metricstransform processor
The metrics transformation processor can be used to rename metrics, as well as add, rename, or delete tagged keys and values. It can also be used to perform scaling and aggregation of metrics across tags or tagged values. The following table provides a complete list of supported operations that can be applied to one or more metrics.
| operation | example (Based on the metric system.cpu.usage) |
|---|---|
| Rename metrics | Rename system.cpu.usage_time |
| Add labels | Add a new label identifirer with a value of 1 |
| Rename label keys | Rename label state to cpu_state |
| Rename label values | For the label state, rename the value idle to - |
| Delete data points | Delete all data points labeled state=idle |
| Toggle data type | Change from int data points to double data points |
| Scale value | Converts from seconds to milliseconds by multiplying the value by 1000. |
| Aggregate across label sets | Keeping only the label state, average all points with the same value for that label |
| Aggregate across label values | For the label state, sum the points whose values are user or system and assign them to used = user + system |
The configuration of our additions here is as follows:
metricstransform:
  transforms:
    action: update
    include: .+
    match_type: regexp
    operations:
      - action: add_label
        new_label: k8s.cluster.id
        new_value: abcd1234
      - action: add_label
        new_label: k8s.cluster.name
        new_value: youdian-k8s
Indicates that we will add the k8s.cluster.id and k8s.cluster.name tags to all metrics.
logging exporter
Logging exporter for exporting data to standard output, mainly used in debugging phase.
prometheus exporter
The Prometheus exporter allows you to specify an endpoint through which metrics data received from a receiver can be exported, so that Prometheus only needs to pull data from that endpoint. The prometheusremotewrite exporter writes metrics directly to a specified address that supports the Prometheus remote write protocol. (The current version of the remote write exporter has been tested with some problems)
Our configuration here is as follows:
prometheus:
  endpoint: 0.0.0.0:9090
  metric_expiration: 180m
  resource_to_telemetry_conversion:
    enabled: true
endpoint: the address where the metrics will be exposed through the path/metrics, i.e. we want to access the metrics data through the above address, here we are indicating that we want to expose the metrics data on port 9090.metric_expiration(default = 5m): defines the length of time the metrics will be exposed without updates.resource_to_telemetry_conversion(default false): if enabled to true, all resource properties will be converted to metrics labels by default.
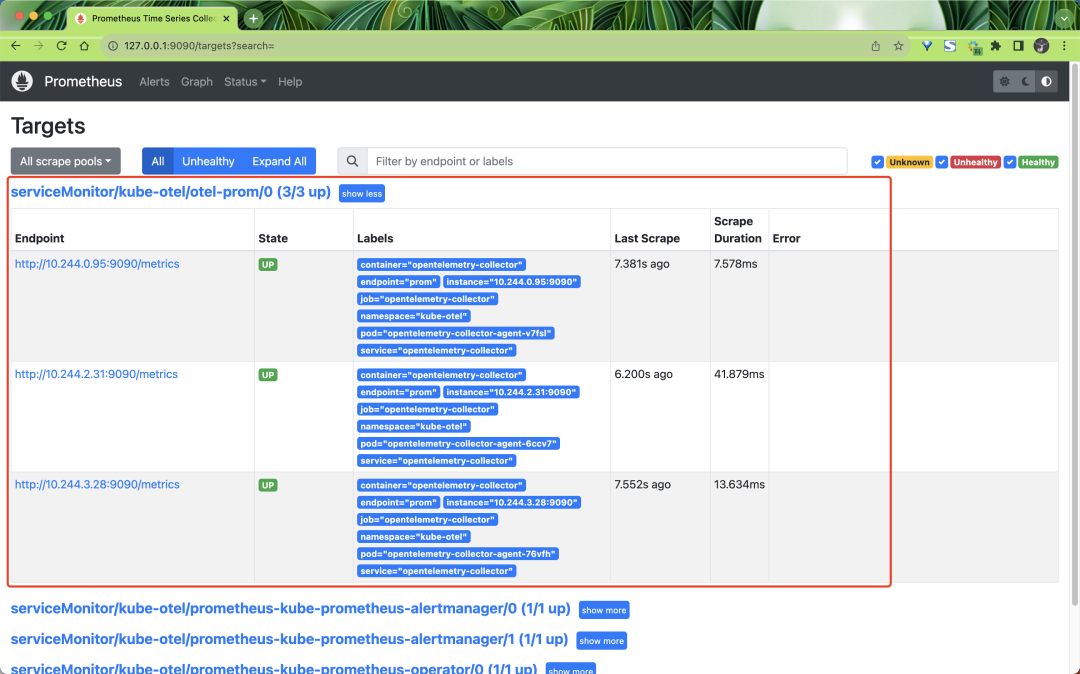
So finally we can go and collect the metrics data exposed by OpenTelemetry Collector on port 9090 in Prometheus by simply creating a ServiceMonitor object as shown below:
apiVersion: monitoring.coreos.com/v1
kind: ServiceMonitor
metadata:
  name: otel-prom
  namespace: kube-otel
  labels:
    release: prometheus
spec:
  endpoints:
    - interval: 10s
      port: prom # We define a service port for prom in helm values
      path: metrics
  selector:
    matchLabels:
      component: agent-collector
      app.kubernetes.io/instance: opentelemetry-collector
Once created we can find the metrics data exposed by OpenTelemetry Collector in Prometheus.
The captured metrics contain a lot of tags inside, which are added by the processor we defined earlier, for example:
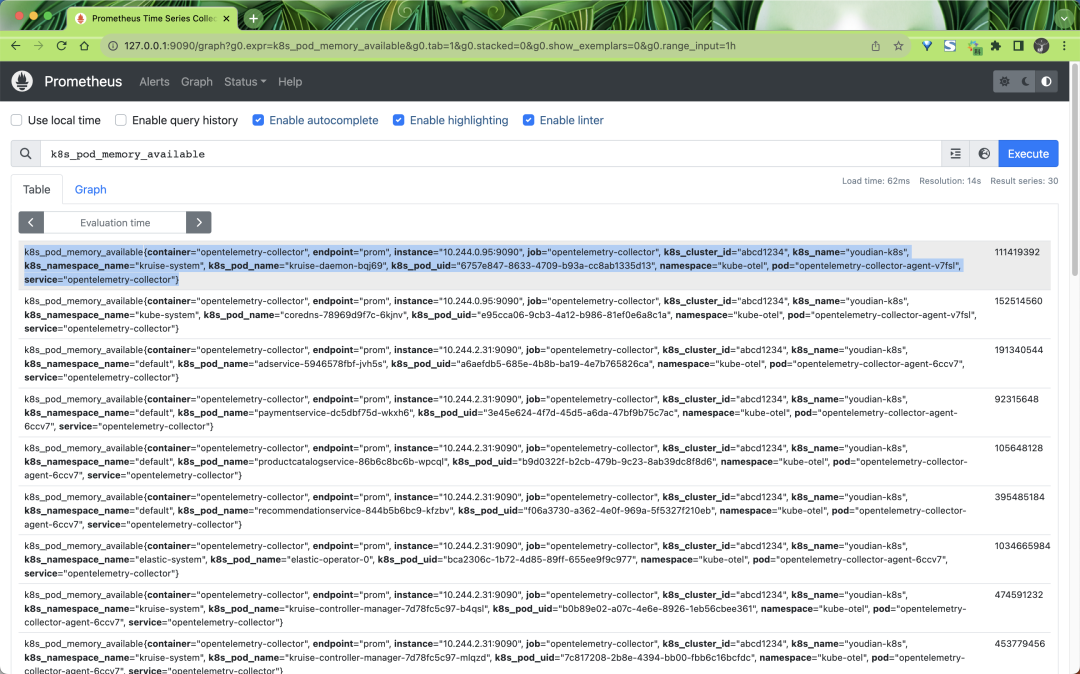
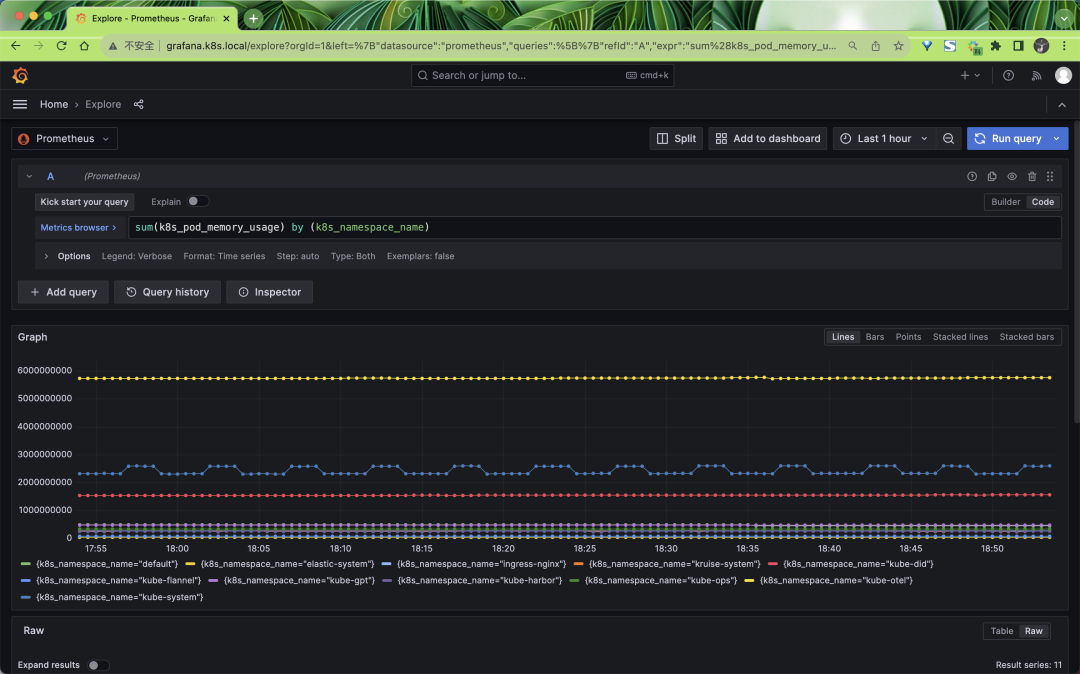
We can also query these metrics through Grafana:
In addition, we can deploy OpenTelemetry Collector’s Deployment mode to collect data for other metrics.